

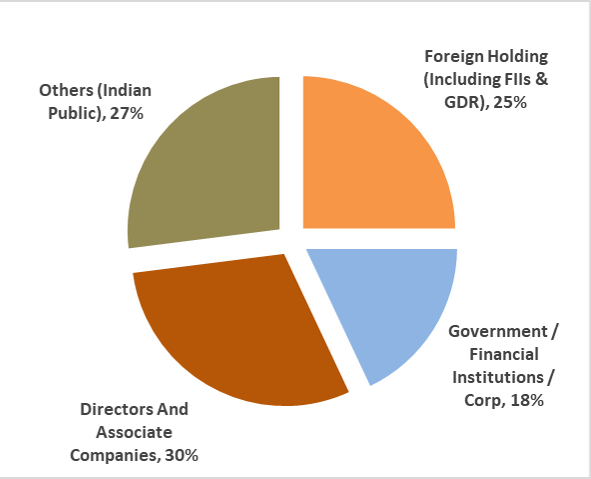
Shareholding Pattern as on December 31, 2024
| Year | Interim Dividend (INR per share) |
Final Dividend (INR per share) |
Total Dividend* (INR Million) |
Dividend Payout ratio (%) | |
|---|---|---|---|---|---|
| 2024-25 | 9.00
7.20 8.10 |
||||
| 2023-24 | 5.40
7.50 6.30 6.30 10.80 |
5182.4 | 19.82% | ||
| 2022-23 | 5.40
7.20 7.20 9.00 |
4111.6 | 15.97% | ||
| 2021-22 | 4.50
5.40 |
1432.3 | 23.03% | ||
| 2020-21 | 9.00 | 1322.7 | 12.84% | ||
| 2019-20 | 5.40
2.70 |
1291.3 | 46.00 | ||
| 2018-19 | 5.40 | 933.6 | - | ||
| 2017-18 | 7.20 | 1260.8 | 78.71 | ||
| 2016-17 | 3.60 | 6.50 | 1785.4 | 30.00 | |
| 2015-16 | 6.00
7.50 |
2439.5 | 40.00 | ||
| 2014-15 | 4.00 | 7.00 | 1934.4 | 61.25 | |
| 2013-14 | 4.00 | 5.00 | 1587.7 | 77.57 | |
| 2012-13 | 3.00 | 4.50 | 1298.6 | 88.79 | |
| 2011-12 | 3.00 | 3.50 | 1139.8 | 79.52 | |
| 2010-11 | 3.50 | 4.50 | 1354.3 | 51.95 | |
| 2009-10 | 8.00 | 1407.9 | 35.57 | ||
| 2008-09 | 2.50
2.50 3.00 |
1425.4 | 10.29 | ||
| 2007-08 | 4.00
3.50 5.00 2.50 |
2672.3 | 19.70 | ||
| 2006-07 | 3.00
4.00 |
4.50 | 2017.1 | 22.83 | |
| 2005-06 | 3.50
2.50 4.00 |
1948.5 | 23.23 | ||
| 2004-05 | 3.50
2.50 |
3.00 | 1942.4 | 24.10 | |
| 2003-04 | 2.50 | 4.00 | 1395.6 | 30.20 | |
| 2002-03 | 4.00 | 858.1 | 37.78 | ||
| 2001-02 | 4.00 | 761.8 | 37.17 | ||
| 2000-01 | 2.75 | 665 | 37.48 | ||
| 1999-00 | 1.50 | 430.9 | 39.01 | ||
| 1998-99 | 2.00 | 638.4 | 50.49 | ||
| 1997-98 | 2.50 | 1.50 | 1265.3 | 77.04 | |
| 1996-97 | 3.00 | 948.93 | 69.56 | ||
| 1995-96 | 2.00 | 575 | 37.73 | ||
| 1994-95 | 2.30 | 607.4 | 35.38 | ||
| 1993-94 | 2.30 | 412.4 | 30.15 | ||
| 1992-93 | 3.25 | 310.2 | 28.46 | ||
| 1991-92 | 3.05 | 261 | 27.84 | ||
| 1990-91 | 2.40 | 171.2 | 46.08 | ||
| 1989-90 | 2.00 | 136.1 | 34.16 | ||
| 1988-89 | 1.20 | 66.8 | 29.37 | ||
| 1988-89 | 1.20 | 66.8 | 29.37 | ||
| 1987-88 | 1.50 | 83.3 | 50.70 | ||
| 1986-87 | 1.25 | 52.8 | 77.64 | ||
| 1985-86 | 1.20 | 37 | 52.31 | ||
| 1984-85 | 0.70 | 17.9 | 94.27 | ||
| 1983-84 | - | - | - | ||
| 1982-83 | - | - | - | ||
| 1981-82 | 1.00 | 25.6 | 57.29 | ||
| 1980-81 | 2.00 | 30.7 | 17.90 | ||
| 1979-80 | 2.50 | 38.3 | 24.25 | ||
| 1978-79 | - | - | - | ||
| 1977-78 | - | - | - | ||
| 1976-77 | 1.50 | 19.2 | |||
| 1975-76 | 2.00 | 19.2 | 16.36 | ||
| 1974-75 | 3.60 | 35.5 | 31.60 | ||
| 1973-74 | 1.20 | 11.5 | 31.99 | ||
| 1972-73 | 2.50 | 12 | 27.89 | ||
| 1970-71 | 2.25 | 10.8 | 31.02 | ||
| 1969-70 | 1.20 | 5.8 | 54.35 | ||
| 1968-69** | 2.50 | 6 | 25.60 | ||
| 1967-68** | 2.00 | 4.8 | 22.00 | ||
| 1966-67** | 2.00 | 3.6 | 20.36 | ||
| 1965-66** | 1.60 | 2.5 | 18.80 | ||
| 1964-65** | 1.10 | 1.7 | 52.63 | ||
| 1963-64** | 1.08 | 1.2 | 46.00 | ||
| 1962-63** | - | - | - | ||
| 1961-62** | 1.00 | 0.9 | 73.00 | ||
| 1960-61** | 0.78 | 0.7 | 57.59 | ||
| 1959-60** | 1.00 | 0.9 | 27.39 | ||
| 1958-59** | 1.50 | 1.4 | 42.75 | ||
| 1957-58** | 1.80 | 1.6 | 24.90 | ||
| 1956-57** | 1.50 | 1.1 | 18.60 | ||
| 1955-56** | 1.50 | 0.9 | 34.00 | ||
| 1954-55** | - | - | - | ||
| 1953-54** | 1.00 | 0.5 | 54.90 | ||
| 1952-53** | 1.00 | 0.4 | 48.20 | ||
| 1951-52* | 1.00 | 0.2 | 30.00 | ||
| 1950-51** | 1.00 | 0.2 | 26.80 | ||
| 1949-50** | 1.00 | 0.2 | 16.00 | ||
| 1949-50** | 0.50 | 0.1 | 48.00 |
* Including dividend distribution tax
** Year ending June 30
| Year | Bonus Shares Issue | |
|---|---|---|
| FY1951-52 | (1:2) | |
| FY1955-56 | (1:5) | |
| FY1963-64 | (1:4) | |
| FY1965-66 | (1:5) | |
| FY1967-68 | (1:3) | |
| FY1969-70 | (1:1) | |
| FY1973-74 | (1:1) | |
| FY1977-78 | (3:5) | |
| FY1981-82 | (2:3) | |
| FY1990-91 | (1:5) |
| Year | Rights Issue | |
|---|---|---|
| FY1952-53 | (2:3) | |
| FY1956-57 | (1:1) | |
| FY1986-87 | (2:3) | |
| FY1991-92 | (1:1) | |
| FY1993-94 | (2:5) |
Kindly Note: (1:2) Its read as one bonus share issued for every 2 shares held by shareholders
Share Buyback
| Year | No. of Equity Shares bought back* |
Average Acquisition Price (L)** |
Total Amount (INR Crores)** | |
|---|---|---|---|---|
| FY2000-01 | 4,29,40,921 | 34.91 | 149.99 | |
| FY2001-02 | 2,55,94,168 | 28.27 | 72.36 | |
| FY2013-14 | 15,45,019 | 267.14 | 41.27 | |
| FY2019-20 | 38,10,581 | 261.60 | 99.99 | |
| FY2021-22 | 41,99,323 | 317.26 | 133.23 |
* No of equity shares bought back includes physical shares, pending delivery.
In the event of bad delivery, the number of shares bought back may undergo a change.
** Includes transaction costs including brokerage costs, securities transaction taxes, service tax, and stamp duty.
NON CONVERTIBLE DEBENTURES (Current)
| Type of Bond | Issue Date | Marutity Date | Coupon | Tenure (Yrs) |
Amount Issued (INR Cr) |
Amount Bought Back (INR Cr) |
Current O/S Amount (INR Cr) |
|
|---|---|---|---|---|---|---|---|---|
| Secured | 02 Nov 2020 | 02 Nov 2028 | 8.05% | 8 | 150 | - | 150 | |
| Secured | 12 Apr 2018 | 12 Apr 2028 | 8.85% | 10 | 300 | - | 300 | |
| Unsecured | 25 May 2017 | 25 May 2027 | 8.25% | 10 | 150 | - | 150 | |
| Unsecured | 10 Nov 2016 | 10 Nov 2026 | 8.24% | 10 | 200 | - | 200 | |
| Unsecured | 10 Nov 2016 | 10 Nov 2025 | 8.24% | 9 | 200 | - | 200 | |
| Unsecured | 31 May 2016 | 31 May 2025 | 8.70% | 9 | 250 | - | 250 | |
| Unsecured | 06 May 2016 | 06 May 2026 | 8.70% | 10 | 250 | - | 250 | |
| Total | 1500 |
NON CONVERTIBLE DEBENTURES (Matured)
| Type of Bond | Issue Date | Marutity Date | Coupon | Tenure (Yrs) |
Amount Issued (INR Cr) |
Amount Bought Back (INR Cr) |
|
|---|---|---|---|---|---|---|---|
| Unsecured | 10 Nov 2009 | 10 Nov 2019 | 9.60% | 10 | 200 | - | |
| Unsecured | 02 Feb 2011 | 02 Feb 2021 | 9.70% | 10 | 100 | - | |
| Unsecured | 25 Apr 2011 | 25 Apr 2021 | 9.70% | 10 | 50 | - | |
| Unsecured | 15 Apr 2011 | 15 Apr 2021 | 9.70% | 10 | 150 | - | |
| Unsecured | 06 Jan 2011 | 06 Jan 2023 | 9.70% | 12 | 100 | - | |
| Unsecured | 18 Jan 2011 | 18 Jan 2023 | 9.70% | 12 | 100 | - | |
| Unsecured | 18 Jan 2017 | 18 Jan 2024 | 7.99% | 7 | 250 | - | |
| Secured | 31 Aug 2017 | 31 Aug 2024 | 8.05% | 7 | 150 | - | |
| Unsecured | 18 Jan 2017 | 18 Jan 2025 | 7.99% | 8 | 250 | - | |
| Unsecured | 20 Aug 2009 | 20 Aug 2019 | 9.75% | 10 | 250 | 15 | |
| Unsecured | 06 Jan 2010 | 05 Jan 2018 | 9.40% | 8 | 100 | - | |
| Unsecured | 08 Feb 2010 | 08 Feb 2018 | 9.35% | 8 | 100 | 15 | |
| Unsecured | 24 Dec 2009 | 24 Dec 2018 | 9.19% | 9 | 100 | - | |
| Unsecured | 06 Jan 2010 | 06 Jan 2019 | 9.40% | 9 | 50 | - | |
| Unsecured | 06 Jan 2010 | 06 Jan 2019 | 9.40% | 9 | 50 | 10 | |
| Unsecured | 08 Feb 2010 | 08 Feb 2019 | 9.35% | 9 | 100 | 15 | |
| Secured | 03 Jul 2009 | 03 Jul 2019 | 9.80% | 10 | 250 | 10 |
 FY-2025
  CY-2025
 Shareholding Pattern as on 31 March 2025
 Q1FY2025 Results